What is the most important thing in the characteristics of sound equipment? Power, frequency range or sound pressure levels - what should you look for? The amplitude-frequency response (AFC) is what can show how this or that audio equipment works. Frequency response is what you should pay attention to first when choosing devices; other characteristics lose all value if the frequency response is poor. The amplitude-frequency characteristic shows the dependence of the deviation in the volume of the reproduced sound in (dB) on its frequency in (Hz).
Human hearing is capable of perceiving sound waves with frequencies ranging from 20 Hz to 20,000 Hz. This is ideal. In fact, this frequency range narrows with age (especially high frequencies) and its scope depends on gender and hearing hygiene. For example, lovers of loud music, headphones and workers in noisy industries partially lose their hearing, and the upper limit of the audible range shifts greatly. Therefore, we once again urge you to take care of your hearing and do not forget about its hygiene. You can read more about this here.
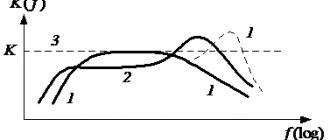
What does good frequency response mean?
If we limit ourselves to one sentence, that the frequency response should have a shape close to a straight line. But we will not limit ourselves, of course, but will tell you in more detail.
If the device has a good frequency response, then it correctly reproduces all low, mid and high frequencies in the correct ratio to each other, which provides clear, rich and rich sound. From the frequency response you can see how many dB the sound deviates from the norm in a specific frequency range. We focus on the following numbers:
- ± 1 dB – minimally audible change in sound pressure;
- ± 3 dB – noticeable but acceptable deviation;
- > 10 dB – a significant deviation in volume, which may cause unpleasant listening sensations.
Recall that the loudness scale, expressed in decibels (dB), is logarithmic, so increasing the volume by 10 dB means that the sound will sound twice as loud. You can read about the sound characteristics here. The unevenness of the frequency response must be indicated by the manufacturer, otherwise you should be wary of this product. Thus, the frequency range within which the sound quality corresponds to the declared one is marked using extreme points (for example, 40 Hz - 16000 Hz), outside this range there is a significant deviation from the average data, and the magnitude of the deviation must also be indicated (for example ± 1 dB or ± 3 dB). For example, the description of the speaker system may say: 50 Hz - 20 kHz (± 3 dB). Therefore, it is worth understanding this recording as follows: this acoustic system has a reliable sound in the range of 50 Hz - 20 kHz and has deviations from linearity in the region of three decibels in both directions, and beyond these boundaries the unevenness of the sound increases sharply. In fact, such a record is not particularly informative and a reason to trust the manufacturer, because The frequency response must be shown in the form of a graph. You have discovered the frequency response graph and... what next? How to read and understand it?
Harmonic and non-harmonic signals.
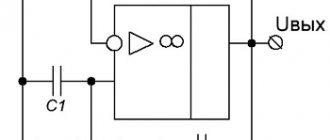
And first, let’s take a closer look at how signals are classified. First of all, we are interested in periodic signals. Their shape repeats after a certain time interval T, called a period. Periodic signals, in turn, are divided into two large classes - harmonic and non-harmonic. A harmonic signal is a signal that can be described by the following function:
y = A cos(wt + \phi)
Here A is the signal amplitude, w is the cyclic frequency, and \phi is the initial phase. A logical question may arise - isn't a sine wave a harmonic signal? Of course, it is, the fact is that sin\alpha = cos(\frac{\pi}{2}\medspace-\medspace \alpha) - that is, the signals differ in the initial phase, accordingly, a sinusoidal signal does not contradict the definition that we given for harmonic vibrations.
The second subclass of periodic signals are non-harmonic oscillations . Here is an example of a non-harmonic signal:
As you can see, despite its appearance, the signal remains periodic, that is, its shape repeats at a time interval equal to the period.
To work with such signals and study them, there is a certain technique, which consists in decomposing the signal into a Fourier series . The bottom line is that a non-harmonic periodic signal (if certain conditions are met) can be represented as a sum of harmonic oscillations with certain amplitudes, frequencies and initial phases. An important nuance is that all harmonic oscillations that participate in the summation must have frequencies that are multiples of the frequency of the original non-harmonic signal. This may not be entirely clear yet, so let’s look at a practical example and take a closer look. And for example, we use the signal that is shown in the figure just above. It can be represented as follows:
u(t) = u_1(t) + u_2(t) = 2 sin(t) + 1.5 sin(2t)
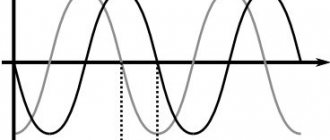
Let's display all these signals on one chart:
The functions u_1(t), u_2(t) are called harmonics of the signal, and the one whose period is equal to the period of the non-harmonic signal is called the first or fundamental harmonic . In this case, the first harmonic is the function u_1(t) (its frequency is equal to the frequency of the non-harmonic signal under study; accordingly, their periods are equal). And the function u_2(t) = 1.5 sin(2t) is nothing more than the second harmonic of the signal (its frequency is twice as high). In the general case, a non-harmonic signal is decomposed into an infinite number of harmonics:
u(t) = U_0 + \sum_{i=0}^{\infty}{U_{k}\thinspace sin(\thinspace kwt + \phi_k\thinspace )}
Here U_k is the amplitude, and \phi_k is the initial phase of the k-th harmonic. As we mentioned a little earlier, the frequencies of all harmonics are multiples of the frequency of the first harmonic, in fact, this is what we see in this formula. U_0 is the zero harmonic, its frequency is 0, it is equal to the average value of the function over the period. Why average? Look - the average value of the sine function over the period is 0, which means that when averaging in this formula, all terms except U_0 will be equal to 0