4.8 / 5 ( 46 votes)
If a person wants to buy good headphones, relying not only on appearance, but also on sound quality, then he should definitely study the question of what amplitude-frequency response is . This term applies to all audio devices without exception (headphones, amplifiers, speakers, stereo systems, radios, etc.). Decoding and describing the frequency response may seem complicated to some, so we will try to tell everything as simply and easily as possible.
- What is the frequency response of headphones?
- Subtleties of measurements
- Fourier analysis
- Headphone frequency response types
- How to choose headphones by frequency response
- Frequency response for different types of headphones
What is amplitude-frequency response
To understand and understand how this or that equipment or speaker system works, you need to know at least in general terms what the amplitude-frequency response of sound is. Frequency response (short abbreviation for parameter) is a fundamental indicator in audio technology, containing a lot of important information.
Amplitude-frequency characteristic (AFC) is the dependence of the amplitude of the output signal of some system on the frequency of its input harmonic signal. WikiPedia
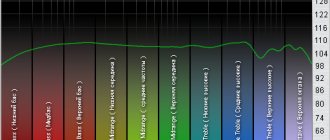
Ultimately, the quality of the amplitude-frequency response of the speaker ultimately determines what sound will be received by the human ear. Considering the versatility and range of human hearing (from 20 Hz at low frequencies and up to 20 kHz at high frequencies), the frequency response should strive to be as ideal as possible (dotted line 3), that is, linear (see graph below).
Rice. 1. Example of amplitude-frequency response.
In reality, as a rule, a distorted frequency response is observed (lines 1 and 2 in the graph above). If the frequency response is noticeably distorted, then the remaining components of the audio equipment will not be able to reproduce sounds at low, medium and high frequencies in the correct proportion. Namely, the correct balance of sound in different ranges makes it rich and rich, pleasant to the human ear.
Resistance or impedance
So, in order. Resistance or impedance. In some cases one thing is indicated, in others another, and there is a certain deceit in this. Yes, if we connect an ohmmeter to the speaker cable terminals, we will get the required 4, 6 or 8 ohms with an accuracy of ±10%. The only problem is that this measurement is incorrect: we are using direct current, but we are interested in the resistance to alternating current in the audio frequency range. And note: the voice coil of a speaker, by definition, cannot have linear (independent of frequency) electrical resistance - after all, it is inductance! And if we take into account that the speaker has resonant frequencies, and there are several such speakers in the column, plus all this is united by a completely nonlinear crossover circuit, then the DC resistance we measured becomes just an approximate figure.
Graph of impedance (resistance) measurement
The correct parameter is impedance, which, as a rule, means resistance to alternating current - in our case, different at different frequencies. Most often, it is presented in the form of a graph of such a dependence. In serious speaker models, such a graph is often included. For speakers with an impedance of 8 ohms, at certain frequencies the impedance can “drop” threefold - say, to 2-3 ohms - and this can become a serious problem for the operation of the amplifier connected to the speaker. A more or less flat impedance curve of a multi-band system is a sign of a serious level of speaker development.
Comparison of frequency response of two speakers
For greater understanding when reading, let’s compare the amplitude-frequency characteristics of two acoustic systems. The result of speaker testing is displayed using a graph. The horizontal axis shows the frequency range, and the vertical axis shows the deviation in decibels. Note that a deviation of 1 dB is the minimum perceptible change in sound, and 3 dB is a small but noticeable fluctuation in volume. Also, the vertical scale is logarithmic, so an increase in sound from 0 to 10 dB means a twofold increase in volume, rather than tenfold in the case of a linear axis.
Rice. 2. Comparison of the frequency response of two acoustic systems. 1st pair of speakers - blue, second pair of speakers - orange
As can be seen from the graphs, the 1st pair of speakers demonstrates an excellent excellent frequency response, almost maintaining a flat horizontal line in the range from 40 Hz to 11 kHz. There are no strong dips or deviations up or down across the entire line of ranges, and deviations are within 1–2 dB.
The second pair of speakers (orange line) is marked by a sharp spike in the high frequency range. Around 6 kHz, the “hump” indicates that in this range the speakers will produce a sharp, irritating sound.
Characteristic sensitivity (Sensitivity, Efficiency)
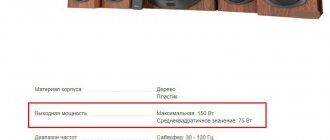
The ratio of the average sound pressure developed by an acoustic system in a given frequency range (usually 100 - 8000 Hz) on the operating axis, normalized to a distance of 1 m and an input electrical power of 1 W. In most Hi-Fi speaker models, the level of characteristic sensitivity is 86 - 90 dB (in technical literature, dB/m/W is often indicated instead of dB). In recent years, high-quality broadband speakers with high sensitivity of 93 - 95 dB/m/W and more have appeared. A parameter that determines what dynamic range, that is, the ratio of maximum sound pressure to minimum, expressed in decibels, the speaker can provide. The wide dynamic range allows you to reproduce complex musical works with great reliability, especially jazz, symphonic, and chamber music.
Frequency response of headphones
Using the amplitude-frequency response of headphones as an example, let's look at what you should pay attention to when assessing the sound quality of a particular speaker.
So, let us recall that the amplitude-frequency response (AFC) is the dependence of the sound pressure level on the frequency of the reproduced output signal.
The technical data of the headphones indicates their operating frequency range. Generally, within the specified range, the sound reproduction frequency of the headphones should be good. It is incorrect to assume that there will be no sound reproduction outside this range. It will be, but noticeably quieter.
The frequency range within which the sound quality corresponds to the declared one is marked using extreme points. Beyond these points, there is a significant deviation from the average data. As a rule, the operating frequency range should be accompanied by an indication of this deviation. Below is an example of the correct selection of 2 audio frequency ranges:
- 19-13700 Hz - 6 dB;
- 8.5-26600 Hz -12 dB.
Rice. 3. Correct selection of 2 audio frequency ranges.
Manufacturers' manipulation may consist in the fact that a number of models (usually inexpensive ones) demonstrate a narrow range of high-quality sound reproduction, while more expensive speaker variations demonstrate a wide range.
In this case, individual methods are used to determine the range of sound frequencies, which do not take into account instrumental analysis. You can read more about the frequency response of headphones on the website doctorhead.ru.
Low playback frequency
The spread of values in the low frequency range ranged from -6 to -20 dB. The sector below 10 Hz turned out to be very sensitive to external noise and vibrations. In addition, the position of the headphones also influenced the final result. If a slight decline towards 10 Hz was recorded, then the lower frequency indicator was recorded as 5 Hz. In the case of a larger roll-off, it should be determined at -12 dB.
Checking a number of statements that headphones can reliably reproduce sound with a frequency of 1 Hz showed that even at a low volume level the analyzed products do not have enough power reserve.
Conclusion: the maximum limitation on the lower frequency is determined not by the drop in the amplitude-frequency characteristic, but by the design features of the headphones. Thus, for models with a long and gentle decline in APC, the lower threshold reaches 5 Hz. In such headphones, at medium volume there is no sound wheezing due to the low amplitude. But for products with high bass and no roll-off in the frequency response in the designated range, the threshold is 20 Hz.
High playback frequency
Analysis of the upper frequencies showed that upper limits comparable to those declared by the manufacturers can be achieved with a deviation from the general level of approximately -15 ~ -20 dB. When adjusting the sound with an equalizer - raising the high frequency range, the downward deviations were about -3 or -6 dB.
As a rule, each manufacturer independently decides on adjusting the sound with an equalizer when publishing the declared frequency response. Orientation according to the graphs shows the limit of the upper playback frequency within -18 dB. Determining the exact frequencies and levels of peaks and troughs is not worth doing, since much depends on how the headphones were worn.
Rice. 4. Frequency response of headphones when 1 V is supplied at different seating depths in the auricle.
At frequencies above 10 kHz, large variations in characteristics can be observed. It depends exactly on how the headphones are fixed in the auricle. Even a displacement of a millimeter or less has a significant impact on sound quality.
The graph of the amplitude-frequency response clearly shows several resonant peaks. Depending on how deep the earphone is in the ear, as well as on the individual physiological characteristics of the auricle, one or another resonance peak will be felt. That is why it is best to choose those products in which these resonance indicators are either smoothed out or not so pronounced.
In addition, the headphone boxes indicate the limiting frequency values beyond which a decline is observed; the amplitude-frequency response itself is not indicated. For example, to indicate the sound characteristics of amplifiers that demonstrate a smoother and more even frequency response, frequency thresholds in dB are indicated. Thus, the 20Hz - 20kHz - 3dB format fixes the range from 20 Hz to 20 kHz as stable, beyond which the signal amplitude will be noticeably less than 3 dB.
In the case of headphones, the frequency response can be affected simply by the fit on the ears for on-ear headphones and the depth of fit for earplugs, the shape and material of the ear pads.
Yes. If you bought headphones, such as earplugs, of poor quality, then you can improve the sound only by replacing the ear pads - from standard silicone to foam, and you will get a better sound picture. Deep bass and high-quality highs will appear.
Electrical (acoustic) power (Power Handling)
Power determines the sound pressure level and dynamic range (taking into account characteristic sensitivity) that a speaker can potentially provide in a certain room. Several types of power, defined by different standards, are used:
Characteristic
At which the speaker provides a given level of average sound pressure. The IEC recommendations set this level to 94 dB at a distance of 1 meter.
Maximum (limit) noise or rating (Power Handling Capacity)
In which the acoustic system can operate for a long time without mechanical and thermal damage when tested with a special noise signal, close in spectrum to real music programs (pink noise). According to the measurement methodology, it coincides with the nameplate power defined in domestic standards.
Maximum Sinusoidal Testing Power, Rated Maximum Sinusoidal Power
The power of a continuous sinusoidal signal in a given frequency range, at which the speaker can operate for a long time without mechanical and thermal damage.
Maximum (maximum) long-term (Long Term Maximum Input Power)
The power that the acoustics can withstand without mechanical and thermal damage for one minute, with the same test signal as for the nameplate power. The tests are repeated 10 times with an interval of 1 minute.
Maximum (maximum) short-term (Short Term Maximum Input Power)
The power that the speaker can withstand when tested with a noise signal with the same distribution as for the nameplate power for 1 second. The tests are repeated 60 times with an interval of 1 minute.
Peak Music Power Output (PMPO)
A favorite parameter of manufacturers concerned with selling their, often not very high-quality, equipment. The measurement technique, defined by the German standard DIN 45500, is as follows: a short-term (less than 2 seconds) signal with a frequency below 250 Hz is supplied to the speaker. The acoustics are considered to have passed the test if there are no audible(!) distortions. This technique allows the manufacturers mentioned above to supply their products with bright stickers with the following texts: “PMPO ...” (or “Musical Power ...”) “...100!”, “...200!” and even... “...1000 Wt!” It is clear that this parameter poorly characterizes the actual quality of sound reproduction.
When choosing a pair of amplifier plus speakers, it is desirable that the actual maximum power of the speaker system exceeds the power of the amplifier by approximately 30 percent or more. In this case, you will be insured against failure of the acoustics due to the signal being supplied to it at an unacceptably high level. For example, with an amplifier with a power of 50 W per channel, you can use speakers with a rated power of 75 W each. What amplifier power is sufficient for high-quality sound reproduction? This is largely determined by the parameters of the room, the characteristics of the acoustic systems, and the needs of the listener himself. With a high degree of approximation, it is believed that for modern medium-sized residential premises the amplifier power should be at least 20 W.
Frequency response of acoustic systems (speakers)
Different acoustic systems also have different methods for measuring frequency response. Thus, for speakers installed in various speakers (as opposed to headphones), the acoustic characteristics are considered correct if readings are taken with minimal echo reflection from the walls. This is usually done either in open space or in a zero-echo chamber.
Headphone parameters are measured on a special stand, the amplitude characteristics of which depend on how it is designed. Therefore, when fixing the operating frequency range, it is necessary to indicate both the deviation itself and the stand data. It is logical that it is possible to compare the frequency ranges of acoustic systems only when taking measurements on one stand. However, in practice, stands with different designs are used, so it is recommended to achieve comparable frequency response data.
Number of channels
The range of good speakers depends largely on the number of channels. Speakers of different sizes can only reproduce a certain range of frequencies. In this case, the following pattern is observed: the larger the diameter, the more bassy such an emitter can “hum.”
In order to fully convey sound frequencies, they are divided into channels, each equipped with several speakers for each range. Today the most common are:
- Two-channel – one woofer, plus a driver for midrange and tweeter;
- Three-channel - one speaker each for bass, midrange and treble.
This applies not only to stereo systems, but to 2.1 speakers. The only difference is that the massive woofer in the latter case is placed in a separate housing. It has been noticed that such a stereo system sounds better, since the “barrel” is usually located separately and does not interrupt the sound of the midrange and high-frequency emitters.
The same is true for speakers 5 1. The design of the front and rear speakers is usually the same, so they reproduce the same sound frequencies.
However, this does not affect the positioning of the sound source when watching a movie on a PC or home theater, and this is precisely what such acoustics are installed for.
Amplifier frequency response
The gain when the signal changes in frequency determines the frequency characteristics of the amplifier. The actual dependence of the output voltage (or gain), marked along the vertical axis (ordinate), is presented below (Fig. 1). The horizontal axis (abscissa) displays the frequency value.
Fig.5. Amplitude-frequency response of the amplifier.
Frequencies are recorded on a logarithmic scale (nonlinear). This stretches (widens) the graph at low frequencies and narrows the range at high frequencies.
The graph clearly shows the drop in gain level in the low-frequency and high-frequency regions. In this case, a clear linear stability of the value in the mid-frequency region is demonstrated. The middle region, located between frequencies f1 (20 Hz) and f2 (20 kHz), accounts for the bandwidth of the amplifier. The indicated frequencies f1 and f2 correspond to points a1 and a2.
These points are also called 3 dB points, respectively, a1 is the lowest point at 3 dB, a2 is the highest point. This region accounts for 70% of the maximum output voltage of the amplifier. In this case, the output power of the amplifier at the indicated frequencies is exactly 2 times less. This gave a second name to the indicated positions, namely: points at half power level.
To guarantee sound amplification over the entire range (20 Hz–20 kHz) accessible to humans, it is necessary that the audio amplifier have a wider bandwidth. Moreover, within the designated area, the value of the ultrasonic amplification factor must be constant. Outside the specified band, the amplification effect may decrease.
Natural sounds, like human speech, as well as music, are a complex symbiosis of completely different sounds in different ranges. That is why, the higher the ability of an amplifier to convert a signal over a wider range without distortion, the higher the quality of the amplification device. An ultrasonic frequency with a limited (narrow) bandwidth will distort a significant number of sounds, as simple amplifiers demonstrate.
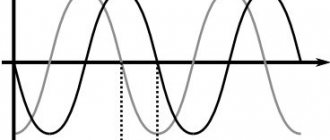
There are 2 types of sound distortion, frequency and amplitude.
Amplitude distortion
Any amplifier has a limiting parameter (threshold) of the output signal that is prohibited from being exceeded. If this value is exceeded, amplitude distortion occurs, which is expressed in the smoothing of the “hump” of the audio signal. Both positive and negative signal peaks, and both signal peaks can be smoothed out.
Rice. 6. Three options for amplitude distortion.
Harmonic Distortion (Distortion, Total Harmonic, THD)
Characterizes the appearance during the conversion process of spectral components that were absent in the original signal, distorting its structure, that is, ultimately, the accuracy of reproduction. An important parameter, since the speaker’s “contribution” to the total nonlinear distortion coefficient of the entire audio path is usually maximum. For example, the coefficient of nonlinear distortion of a modern amplifier is hundredths of a percent, while the typical value of this parameter for acoustics is a few percent. As the signal power increases, the nonlinear distortion factor increases.
Frequency distortion
Sound amplifiers must provide, as a result of hardware processing, an output signal that is undistorted in its shape (the amplitude may vary). As a rule, the audio signal at the input is a combination of different frequency sinusoidal signals, as well as their derivatives. For high-quality amplification and subsequent playback, all components of the input signal must be amplified equally.
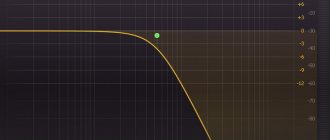
In other words, it is necessary to fix the same frequency gain. In the graph (see above), the frequency response of an ideal signal in the passband is displayed as a flat line. If dips or “humps” are observed, the signal is distorted.
Rice. 7. Frequency response of an amplifier, which has a more significant amplification of high-frequency signals.
The figure above (Fig. 7) demonstrates the frequency response of an amplifier, which has a more significant amplification of high-frequency signals compared to a low-frequency signal, where a smoother line is observed. Consequently, high frequencies will prevail in the distorted output signal.